Blog WHS website
Long-term trends
At the wrap-ups of the past WHC meetings, I’ve tried to incorporate some trends regarding the WHC process. These were based on ad-hoc queries of elements that stood out, such as the number of sites with a name change or those inscribed only on 1 criterion. I’ve now turned these into a proper page, where you can compare these key data against all years a WHC session was held. The page - best viewed on a laptop-wide screen – can be found here. What trends can we derive from it?

Notable years
The year with the most inscriptions was 2000: 61. Imagine the number of ‘armchair ticks’ you could have had from that! A further 13 were not inscribed at that session, so 74 were discussed at the meeting overall. That must have been a long session, although we don’t have a record of that since the live streams started only in 2012. On the other hand, 1989 only had 7 sites inscribed.
This year (2024) was the smoothest in history, with only 4 sites from the initial batch not being inscribed (I am counting those withdrawn right before the session as well). In the early years, it was common to turn back high numbers, for example, 41 in 1980 and 40 in 1979. It must be noted that so early there seem to not have been any plenary discussions about individual sites and there were 2 sessions a year (with a Bureau session as the prep for the WHC session).
Regarding Extensions, it can be concluded that it wasn’t common in the first 12 years of WHC meetings. But even in 1980, Ohrid was extended from a natural site into a mixed site. In later years there are always a few, but without significant outliers or trends.
I picked 2 parameters to represent the global balance: the number of European sites inscribed versus African sites. Especially in the late 1990s and the year 2000, the European numbers ran high. In 2000, 34 of such sites were inscribed (56% of the total), and in 1997 25 (54%). 1982 only had 3 out of 24 from Europe.
The year with the most African sites inscribed was as early as 1980, which saw 4 Ethiopian WHS inscribed (including Aksum), 2 from the DRC and 1 from Ghana. At 7 sessions, no African sites were inscribed at all. One could even argue that the best years for African sites were the early ones, as 1978, 1979 and 1981 were good as well in that respect.
For the transboundary sites, I have combined transboundary (=contiguous) and serial transnational (=non-contiguous) in one number. My guess would have been that it is more common in recent years, but we do not see large differences across the years. All are within a 0-4 range.
When a site is inscribed on a single criterion only, it does say something about the width of its values. It’s a niche aspect that is rewarded, or the only aspect left where ICOMOS or IUCN after thinking positively could see some OUV. Especially the double WHC sessions of 2021 and 2023 scored poorly in this regard, with respectively 12 (35%) and 15 (33%) of such sites. Percentage-wise, the years 1992 (40%) and 2018 (37%) do even worse.
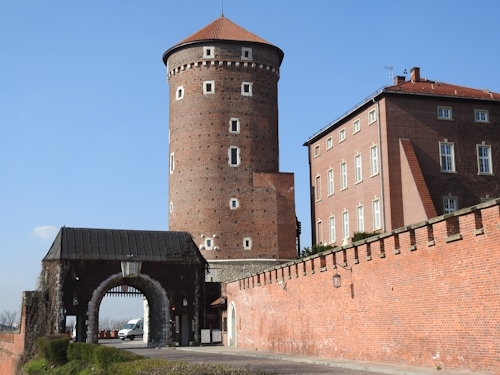
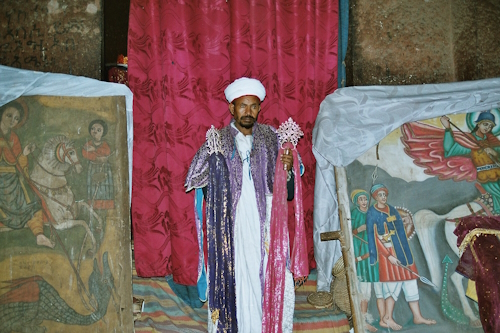
The first year (1978) still is the best-rated year – with 4.08 it seems unlikely to ever be surpassed. It included for example Galapagos, Lalibela, Krakow and Yellowstone (the first 3 are pictured in this post). Even the lowest-ranked site of that year (Goree) has an average above 3 stars. There were only 12 sites inscribed that year, which also helped to maintain a high average.
The trends
So where does this leave us with high-level trends?
- Numbers go down: the yearly number of sites put forward and inscribed have been on or below the average of 27 since 2005. The maximum set now to discuss is 35, but the number of inscribed sites stays far from that.
- Quality goes down: the average ‘quality’ of the sites inscribed has been on a downward trend since 2003. It only exceeded the average of 3.37 twice in the past 20 sessions: in 2013 (3.44) and 2016 (3.38). 'Bad' years are often caused by including multiple 'very bad' (< 2*) sites. 2009 saw Stoclet, La Chaux-de-Fonds and Loropeni, while 2023 had no less than 7 of those.
- Despite the efforts to stimulate inscriptions from Africa and slow down the European countries, no trend break has been visible (yet). It is of interest to look at this from a country perspective too (non-European Saudi Arabia surely has caught up), but I will leave that for another upcoming statistics page.
Overall, the whole process overheated around the year 2000. After that measures were taken to limit the numbers to discuss (it was getting too costly) and better balance the list from a global perspective. The first action seems to have had more effect than the latter.
Are there any other conclusions that you’d draw from these data?
Els - 11 August 2024
Comments
Esteban Cervantes Jiménez 13 August 2024
Excellent summary of results. It confirms trends that people at this page has seen for years, providing figures to them. There are also surprises, one also transboundary sites were on a growing streak.